> ## Documentation Index
> Fetch the complete documentation index at: https://docs.adaptyvbio.com/llms.txt
> Use this file to discover all available pages before exploring further.
# Binding Data Package
> What arrives in your downloadable binding data bundle and how to work with it.
When a kinetics experiment is pushed to the portal, we generate a new archive that captures the exact data version customers can download.
 ## Getting Started
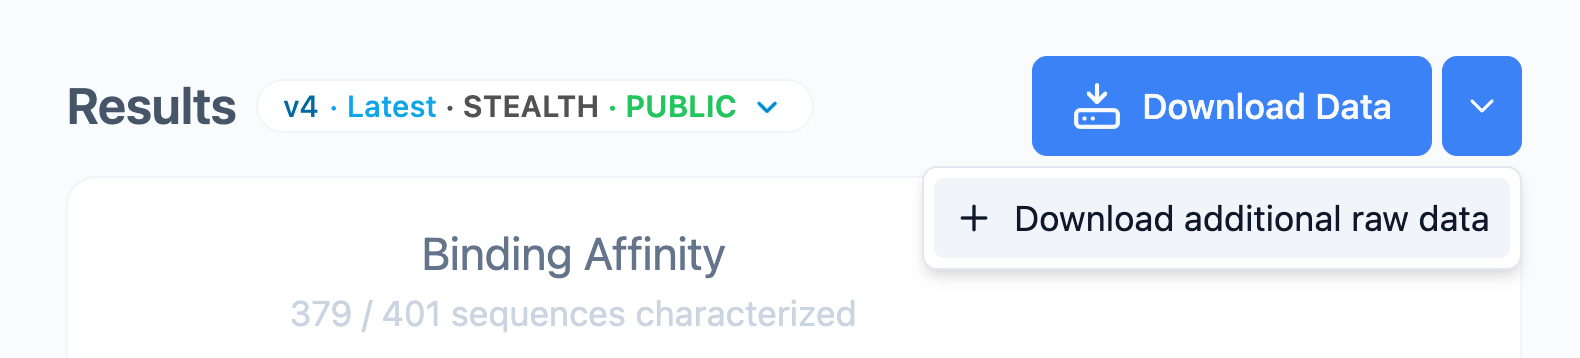
1. Download the `package.zip` archive from the Foundry Portal (`Download Data` → `Download additional raw data`).
2. Unzip and open the extracted `package/` directory.
3. Use the sections below as a field guide while browsing.
All contents are safe to share publicly and ready for downstream analysis or visual inspection.
## Folder Overview
### `kinetics/`
PNG sensorgrams for each sample replicate, named `_.png`.
Use these plots for quick visual QC without loading raw data.
### `raw_data/`
CSV exports of the instrument readouts, using `__.csv`.
Columns:
* `t`: time in seconds
* `y`: instrument response in nanometers
Additional notes:
* Values are rounded to three decimals to reduce package size.
* Neutralisation controls follow `control__.csv` and share the same schema.
### `fit_data/`
Modelled sensorgrams for replicates with approved fits (`t`, `y` columns), matching the `raw_data/` filename convention. Overlay these with the raw traces to reproduce kinetics calculations.
### `aux/`
Metadata lives in `replicate_info.csv`:
* `name`: OS-safe protein identifier
* `replicate`: replicate index
* `method`: `BLI` or `SPR`
* `MAE`: mean absolute error (two decimals)
* `rel_MAE`: MAE normalized by maximum signal
* `rmax_estimate`: estimated Rmax value
### `blanks/` (when provided)
Background and reference material for the experiment.
* `raw_data/`
* `_.csv`: blank curves (`t`, `y`)
* `read_data.csv`: metadata with `read`, `run`, `concentration_nM`, `filename`
* `figures/`
* `blank_.png`: visualizations of blank sensorgrams
* `run_mapping.csv`
* Columns: `name`, `replicate`, `runs` — shows blank runs tied to each replicate.
## Additional Notes
* Filenames replace spaces and special characters with underscores for compatibility.
* Folder structure is machine-readable and works well with automated pipelines.
* Each archive reflects the current data version; redownload after updates to stay in sync.
## Getting Started
1. Download the `package.zip` archive from the Foundry Portal (`Download Data` → `Download additional raw data`).
2. Unzip and open the extracted `package/` directory.
3. Use the sections below as a field guide while browsing.
All contents are safe to share publicly and ready for downstream analysis or visual inspection.
## Folder Overview
### `kinetics/`
PNG sensorgrams for each sample replicate, named `_.png`.
Use these plots for quick visual QC without loading raw data.
### `raw_data/`
CSV exports of the instrument readouts, using `__.csv`.
Columns:
* `t`: time in seconds
* `y`: instrument response in nanometers
Additional notes:
* Values are rounded to three decimals to reduce package size.
* Neutralisation controls follow `control__.csv` and share the same schema.
### `fit_data/`
Modelled sensorgrams for replicates with approved fits (`t`, `y` columns), matching the `raw_data/` filename convention. Overlay these with the raw traces to reproduce kinetics calculations.
### `aux/`
Metadata lives in `replicate_info.csv`:
* `name`: OS-safe protein identifier
* `replicate`: replicate index
* `method`: `BLI` or `SPR`
* `MAE`: mean absolute error (two decimals)
* `rel_MAE`: MAE normalized by maximum signal
* `rmax_estimate`: estimated Rmax value
### `blanks/` (when provided)
Background and reference material for the experiment.
* `raw_data/`
* `_.csv`: blank curves (`t`, `y`)
* `read_data.csv`: metadata with `read`, `run`, `concentration_nM`, `filename`
* `figures/`
* `blank_.png`: visualizations of blank sensorgrams
* `run_mapping.csv`
* Columns: `name`, `replicate`, `runs` — shows blank runs tied to each replicate.
## Additional Notes
* Filenames replace spaces and special characters with underscores for compatibility.
* Folder structure is machine-readable and works well with automated pipelines.
* Each archive reflects the current data version; redownload after updates to stay in sync.